Click here for your access to the BEST tool on the Planet for new listing alerts.
Days-on-Market? How about minutes?
Really nice well-priced properties will sell quickly
 |
Clearly illustrated by the chart
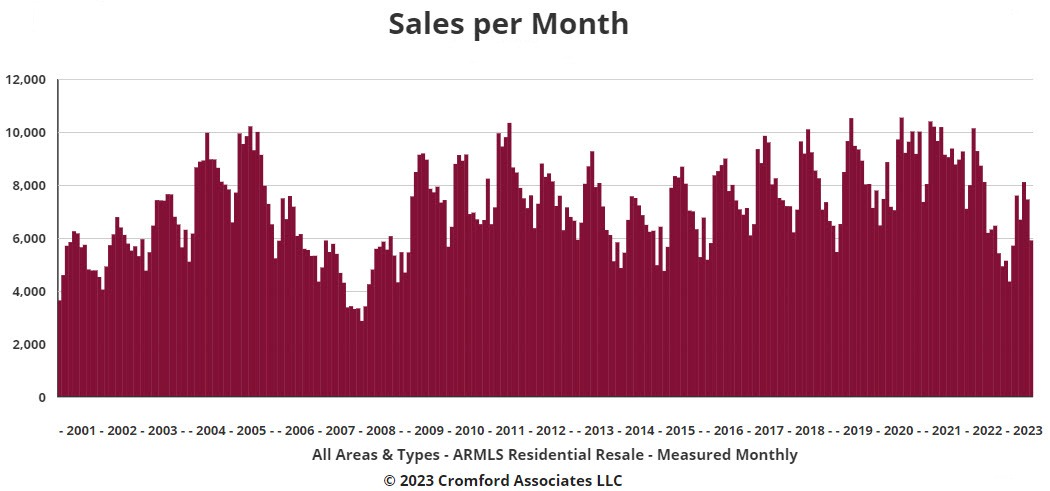
Annual Closings/Sales Cycle Overall Trend |
|
|
|
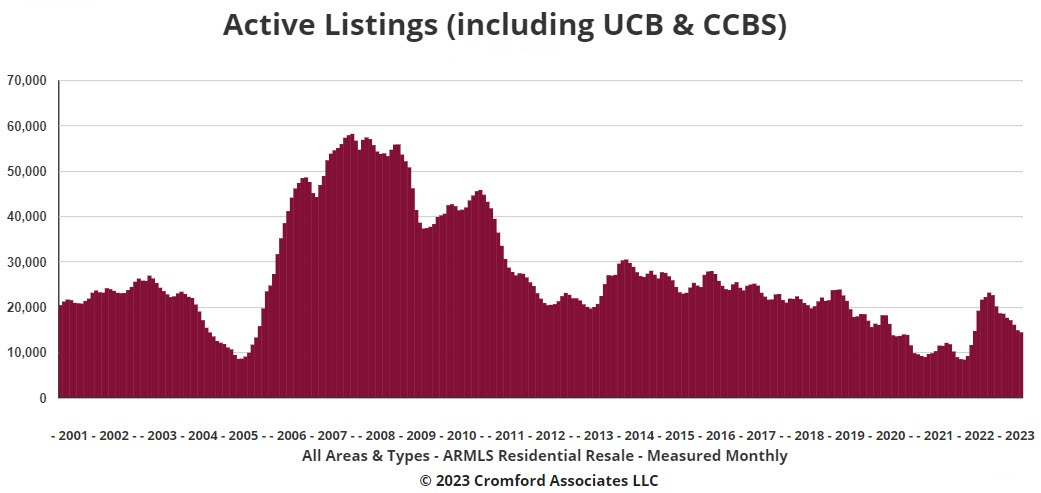
The Problem Maricopa County has had the highest in-migration of ANY county in the USA every month for a half-dozen+ years. This chart illustrates the decreasing “supply” of homes being offered for sale that those new arrivals are facing. |
|
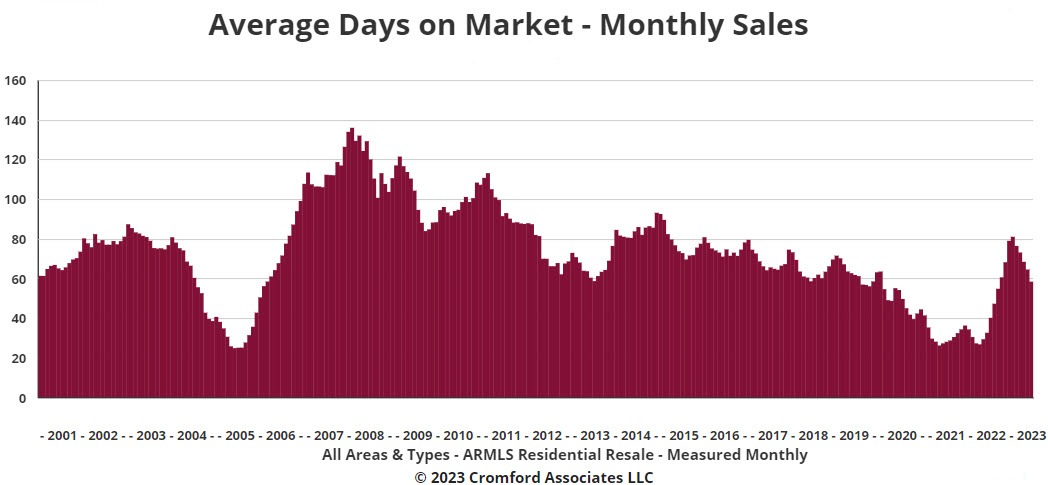 |
Days on Market (DOM) Only a combination of condition issues and over-pricing, or bad location, will keep a property from selling reasonably promptly in the current metro-Phoenix market. The recent spike in DOM was due to a massive and extremely quick increase in interest rates. Rates are coming down and the market is adjusting. A slow home shopper is going to be a frustrated home shopper. |